RSI Bands [APIDEVs]RSI BANDS:
It is an exclusive product of ApiDevs, this indicator selectively integrates a series of highly advanced algorithms that aim to provide the trader with an effective and profitable trading system, based on a series of conditions that project the price direction with a reasonable probability.
This indicator bears the name of “RSI Bands”, this is because we have based this trading system on the “Relative Strength Index ( RSI )”, the strength of this indicator is centennial and we at APIDEVs have decided to focus our efforts on the development of powerful tools based on the favorite indicators of the afternoon.
WHAT IT HAS INCORPORATED:
1. Exponential Moving Average (EMAs): The RSI Bands has, by default, a band composed of two moving averages of 10 and 55 exponential periods, which can be modified in the indicator menu.
• Possibility of changing the value of the EMAs.
• Function was enabled to change the color and transparency of the bands.
• Visual alerts SHORT (L) and LONG (L) were added when there is the crossing of the EMAS.
• Hull Moving Average ( HMA ) of 100 periods was also incorporated, also modifiable for those who wish to strengthen their visual analysis. (Disabled by default)
• We also add an Exponential Moving Average ( EMA ) of 200 periods to mark the trend. (Disabled by default).
2. ATR ( Average True Range ): This indicator has two main functions in the RSI Bands, the first is to mark the trend of the asset and the second is to establish a margin of safety in price volatility , that is, a maximum estimate of the setbacks without this representing a change in the direction of the price.
3. RSI ( Relative Strength Index ): It was visually incorporated into the RSI Bands, the graph is obtained on the right side and its purpose is to visually indicate where the price is with respect to the RSI PRO+ indicator, offering the following improvements :
• ALERT SYSTEM: THE RSI PRO+ has the ADX incorporated into its algorithm, which allows establishing a filter that will provide reliable inputs, represented by the LONG (L) and SHORT (S) signals.
• FILTER AGAINST TREND: The signals described above will be activated according to the crossing of the RSI above the 50 point, provided that the ADX agrees with the market direction.
• Possibility of deactivating this graphical representation.
4. ADX ( Average Directional Index ): The ADX in this indicator is intended to estimate the strength of the movement, it is present in each part of the code, either to indicate the strength of the market or to serve as a filter against trend. In the same way, we apply certain exclusive improvements for this indicator:
• It was established as default values of the ADX that the Level Range was 10 and the Level Trend 25. This significantly changes the behavior of this indicator, almost completely eliminating the zone of disinterest that was usually considered.
• A function was activated to paint the sails the color of the ADX .
5. ADX Ocillator: Yes, we developed a Wave oscillator type ADX and incorporated it into this strategy. From this indicator, which we recommend using in conjunction with the RSI Bands, we extracted the LONG (L) and SHORT (S) signals. The ADX Oscillator is the improved version of the traditional ADX as it offers the following improvements:
• Its interpretation is much simpler.
• Allows you to set entry and exit signals during the trend change and during the price path.
• It has an integrated alert system.
STRATEGY PANEL:
This panel is an exclusive creation of APIDEVs, and its purpose is to parameterize five conditionals based on the indicators that make up our RSI strategy, giving the trader an immediate vision of the status of the asset analyzed considering this strategy. That is, we decided to transfer our experience of using this indicator on a panel that will project the price trajectory visually. It has the following characteristics:
• It can be placed anywhere on the screen through the main menu of the indicator, it can even be deactivated.
• It can be resized, we designed this to adapt to all types of screens, including those of mobile phones.
• It has an upper panel called "Project" which will calculate the percentage probability that the price has to take a direction based on all the indicators incorporated into the strategy. Their values range from (+ 100%) to (-100%).
STRATEGY PANEL PARAMETERS:
1. EMAs: This panel has 2 variables:
• LONG: If the fast EMA is above the slow EMA .
• SHORT: If the fast EMA is below the slow EMA .
2. RSI: This panel has 3 variables:
• LONG: The RSI should be bullish (green) and above the 50 point.
• SHORT: The RSI should be bearish (red) and be below the 50 point.
• RANK: (Range)this condition is activated when there is no concordance with the RSI condition and its crossing.
3. ATR: This panel has 2 variables:
• LONG: When the price is above the ATR.
• SHORT: When the price is below the ATR.
4. ADX: This panel has 3 variables:
• LONG: The ADX is green. That is, the DI + is above the DI-.
• SHORT: The ADX is red. That is, the DI- is above the DI +.
• RANK: ADX is below point 10.
It also has a numerical value that indicates the value of the ADX and two texts indicating the strength of the trend:
• Trend ( bullish or bearish ).
• Strong trend ( bullish or bearish ).
5. OSC: This panel has 3 variables:
• LONG: The oscillator slopes upward and the built-in ADX is green.
• SHORT: The oscillator slopes downward and the built-in ADX is red.
• RANK: The oscillator slopes downward and the built-in ADX is green and the opposite. In short, there is no coherence in the movement of the oscillator and the projection of the ADX .
Cari dalam skrip untuk "relative strength"

Strength of Divergence Across Multiple IndicatorsOverview:
One-stop shop for all your divergence needs, including:
(1) A single metric for divergence strength across multiple indicators.
(2) Labels that make it easy to spot where the truly strong divergence is by showing the overall divergence strength value along with the number of divergent indicators. Hovering over the label shows a breakdown of each divergent indicator and its individual divergence strength value.
(3) Fully customizable, including inputs for pivot lengths, divergence types, and weights for every component of the divergence strength calculation. This allows you to quickly and easily optimize the output for any chart. Don't worry, the default settings will have you covered if you're not interested in what's going on under the hood.
The Divergence Strength Calculation:
The total divergence strength value is the sum of the divergence strengths of all indicators for which divergence was detected at a given bar. Each indicator's individual divergence strength is comprised of two basic components: (1) |ΔPrice| - the magnitude of the change in price over the divergence period (pivot-to-pivot), and (2) |ΔIndicator| - the magnitude of the change in indicator value over the divergence period.
Because different indicators' scales and volatility can vary greatly, the Δ values are expressed in terms of standard deviation to ensure that the values are meaningful and equitable across all indicators and assets/instruments/currency pairs, etc:
|ΔIndicator| = |indicator_value_1 - indicator_value_2| / 2 * StDev(indicator_series,100)
Calculation Weights:
All components of the calculation are weighted and can be modified on the Inputs page in settings (weights are simply multipliers). For example, if you think hidden divergence should carry less weight than regular divergence, you can assign it a lesser weight. Or if you think RSI divergence is worth more than OBV divergence, you can adjust their weights accordingly. List of weights:
Regular divergence weight - default = 1
Hidden divergence weight - default = 1
ΔPrice weight - default = 0.5 (multiplied by the ΔPrice component)
ΔIndicator weight - default = 1.5 (multiplied by the ΔIndicator component)
RSI weight - default = 1.1
OBV weight - default = 0.8
MACD weight - default = 0.9
STOCH weight - default = 0.9
Development for additional indicators is ongoing, as is research into the optimal weight configuration(s).
Other Inputs:
Pivot lengths - specify the number of bars before and after each pivot high/low to consider it a valid candidate for divergence.
Lookback bars and Lookback pivots - specify the number of bars or the number of pivots to look back across.
Price sources - specify separate price sources for bullish and bearish divergence
Display settings - specify how lines and labels should display, including which divergence strength values should show the largest labels. Include/exclude specific divergence types and indicators.
Please report any bugs, or let me know if you have any enhancement suggestions or requests for additional indicators.
@reees

[blackcat] L1 RSMKLevel 1
Background
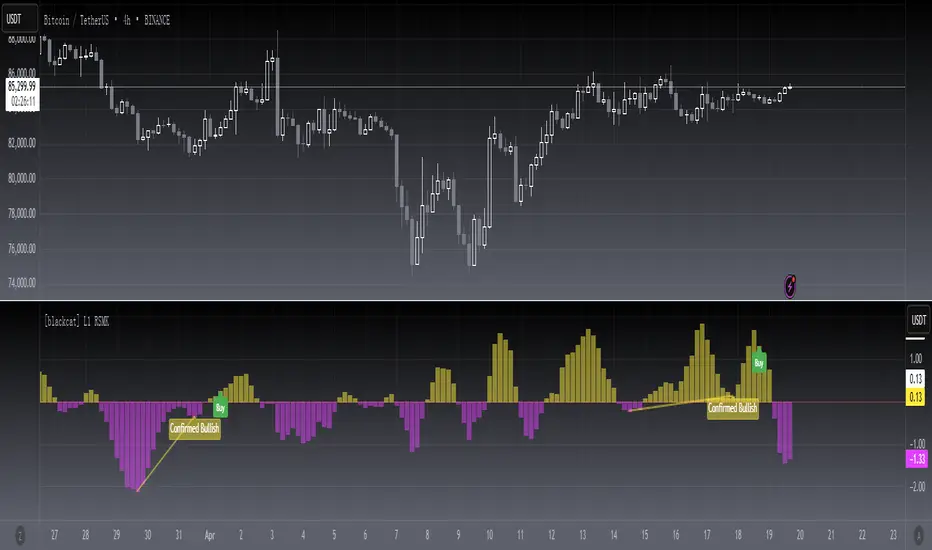
This is a modified version of indicator from Markos Katsanos’ article in the March issue, “Using Relative Strength To Outperform The Market”.
Function
In “Using Relative Strength To Outperform The Market” in this issue, author Markos Katsanos presents a trading system based on a new relative strength indicator he calls RSMK. The indicator improves on the traditional relative strength indicator by separating periods of strong or weak relative strength.
I found it helpful for divergence identification.
Remarks
This is a Level 1 free and open source indicator.
Feedbacks are appreciated.
RSI Bands [APIDEVs]RSI BANDS:
It is an exclusive product of ApiDevs , this indicator selectively integrates a series of highly advanced algorithms that aim to provide the trader with an effective and profitable trading system, based on a series of conditions that project the price direction with a reasonable probability.
This indicator bears the name of “RSI Bands” , this is because we have based this trading system on the “Relative Strength Index (RSI)” , the strength of this indicator is centennial and we at APIDEVs have decided to focus our efforts on the development of powerful tools based on the favorite indicators of the afternoon.
WHAT IT HAS INCORPORATED:
1. Exponential Moving Average (EMAs): The RSI Bands has, by default, a band composed of two moving averages of 10 and 55 exponential periods, which can be modified in the indicator menu.
• Possibility of changing the value of the EMAs.
• Function was enabled to change the color and transparency of the bands.
• Visual alerts SHORT (L) and LONG (L) were added when there is the crossing of the EMAS.
• Hull Moving Average (HMA) of 100 periods was also incorporated, also modifiable for those who wish to strengthen their visual analysis. (Disabled by default)
• We also add an Exponential Moving Average (EMA) of 200 periods to mark the trend. (Disabled by default).
2. A TR (Average True Range): This indicator has two main functions in the RSI Bands, the first is to mark the trend of the asset and the second is to establish a margin of safety in price volatility, that is, a maximum estimate of the setbacks without this representing a change in the direction of the price.
3. RSI (Relative Strength Index): It was visually incorporated into the RSI Bands, the graph is obtained on the right side and its purpose is to visually indicate where the price is with respect to the RSI PRO+ indicator, offering the following improvements :
• ALERT SYSTEM: THE RSI PRO+ has the ADX incorporated into its algorithm, which allows establishing a filter that will provide reliable inputs, represented by the LONG (L) and SHORT (S) signals.
• FILTER AGAINST TREND: The signals described above will be activated according to the crossing of the RSI above the 50 point, provided that the ADX agrees with the market direction.
• Possibility of deactivating this graphical representation.
4. ADX (Average Directional Index): The ADX in this indicator is intended to estimate the strength of the movement, it is present in each part of the code, either to indicate the strength of the market or to serve as a filter against trend. In the same way, we apply certain exclusive improvements for this indicator:
• It was established as default values of the ADX that the Level Range was 10 and the Level Trend 25. This significantly changes the behavior of this indicator, almost completely eliminating the zone of disinterest that was usually considered.
• A function was activated to paint the sails the color of the ADX.
5. ADX Ocillator: Yes, we developed a Wave oscillator type ADX and incorporated it into this strategy. From this indicator, which we recommend using in conjunction with the RSI Bands, we extracted the LONG (L) and SHORT (S) signals. The ADX Oscillator is the improved version of the traditional ADX as it offers the following improvements:
• Its interpretation is much simpler.
• Allows you to set entry and exit signals during the trend change and during the price path.
• It has an integrated alert system.
STRATEGY PANEL:
This panel is an exclusive creation of APIDEVs , and its purpose is to parameterize five conditionals based on the indicators that make up our RSI strategy, giving the trader an immediate vision of the status of the asset analyzed considering this strategy. That is, we decided to transfer our experience of using this indicator on a panel that will project the price trajectory visually. It has the following characteristics:
• It can be placed anywhere on the screen through the main menu of the indicator, it can even be deactivated.
• It can be resized, we designed this to adapt to all types of screens, including those of mobile phones.
• It has an upper panel called "Project" which will calculate the percentage probability that the price has to take a direction based on all the indicators incorporated into the strategy. Their values range from (+ 100%) to (-100%).
STRATEGY PANEL PARAMETERS:
1. EMAs : This panel has 2 variables:
• LONG : If the fast EMA is above the slow EMA.
• SHORT : If the fast EMA is below the slow EMA.
2. RSI : This panel has 3 variables:
• LONG : The RSI should be bullish (green) and above the 50 point.
• SHORT : The RSI should be bearish (red) and be below the 50 point.
• RANK: (Range)this condition is activated when there is no concordance with the RSI condition and its crossing.
3. ATR : This panel has 2 variables:
• LONG : When the price is above the ATR.
• SHORT : When the price is below the ATR.
4. ADX: This panel has 3 variables:
• LONG : The ADX is green. That is, the DI + is above the DI-.
• SHORT : The ADX is red. That is, the DI- is above the DI +.
• RANK : ADX is below point 10.
It also has a numerical value that indicates the value of the ADX and two texts indicating the strength of the trend:
• Trend (bullish or bearish).
• Strong trend (bullish or bearish).
5. OSC : This panel has 3 variables:
• LONG : The oscillator slopes upward and the built-in ADX is green.
• SHORT : The oscillator slopes downward and the built-in ADX is red.
• RANK : The oscillator slopes downward and the built-in ADX is green and the opposite. In short, there is no coherence in the movement of the oscillator and the projection of the ADX.

Multiple Oscillator Crossing - TradingEDThis case study is based on different previous studies: ADX Triple , MACD Triple & RSI Triple , with three different counts to compare different oscillations of each indicator. Actually, this indicator is complementary to those previously mentioned . The use of this indicator is restricted to private use, and it can be used only by invitation. Different functionalities have been added to the original codes, such as alerts and signals that seek to make trading much easier to interpret by any type of trading operator of any experience level , from beginner to intermediate and advanced .
Key components of the original ADX indicator:
• The DIRECTIONAL MOVEMENT INDEX (DMI) is a technical indicator that measures both the strength and direction of a price movement and is intended to reduce false signals.
• The DMI uses two standard indicators, one negative ( -DI ) and one positive ( +DI ), in conjunction with a third, the AVERAGE DIRECTIONAL INDEX ( ADX ), which is non-directional but shows momentum.
• The larger the spread between the two primary lines, the stronger the price trend. If +DI is way above -DI the price trend is strongly up. If -DI is way above +DI then the price trend is strongly down.
• ADX measures the strength of the trend, either up or down; a reading above 20 indicates a strong trend.
ADX is plotted as a single line with values ranging from a low of zero to a high of 100. ADX is non-directional; it registers trend strength whether price is trending up or down. The indicator is usually plotted in the same window as the two DMI lines, from which ADX is derived. When +DI is above -DI, there is more upward pressure than downward pressure in the price. Conversely, if -DI is above +DI, then there is more downward pressure on the price. This indicator may help traders assess the trend direction. Crossovers between the lines are also sometimes used as trade signals to buy or sell, theay are the main trade signals. A long trade is taken when the +DI crosses above the -DI and an uptrend could be underway. Meanwhile, a sell signal occurs when the +DI instead crosses below the -DI.
Key components of the original RSI indicator:
● The Relative Strength Index ( RSI ) is a popular momentum oscillator developed in 1978.
● The RSI provides technical traders signals about bullish and bearish price momentum, and it is often plotted beneath the graph of an asset's price.
● An asset is usually considered overbought when the RSI is above 70% and oversold when it is below 30%.
It is a momentum indicator used in technical analysis that measures the magnitude of recent price changes to assess overbought or oversold conditions in the price of an asset. The RSI is displayed as an oscillator (a line chart moving between two extremes) and can read from 0 to 100. Overbought does not necessarily mean that the price will reverse lower, just as oversold does not mean that the price will reverse higher. Rather, the overbought and oversold conditions simply alert traders that the RSI is near the extremes of its recent readings.
Key components of the original MACD indicator:
● The Moving Average Convergence Divergence ( MACD ) is calculated by subtracting a long period (26) Exponential Moving Average ( EMA ) from a short (12) period EMA .
● MACD triggers technical signals when it crosses above (to buy) or below (to sell) its signal line.
● The speed of crossovers is also taken as a signal of a market is overbought or oversold.
● MACD helps traders to understand whether the bullish or bearish movement in the price is strengthening or weakening.
It is a momentum indicator that follows the trend and shows the relationship between two moving averages of the price of a security. It can function as a trigger for buy and sell signals, when you cross above (to buy) or below (to sell) your signal line. It helps to understand if the movement is bullish or bearish , if it is getting stronger or weaker. The further the MACD is above or below its baseline, it indicates that the distance between the two EMAs will be growing, often shown with a histogram that graphically represents the distance between the MACD and its signal line, and It is used to identify when the bullish or bearish momentum.
Main functions of this modified indicator:
1) The SOURCE for the counts can be determined by the trader (close, open, etc).
2) In some cases, you can select the type of MOVING AVERAGE , among many available options ( SMA , EMA , DEMA , HMA , etc.)
3) The MEASURE can be based on a CANDLES count if you are trading OHLC Charts from 1D onwards , or if your trading is intraday, you can also select counts by MINUTES , HOURS or DAYS , depending on your trading style.
4) LENGTH , by default it will be loaded as in the STRATEGY , but considering the previous point, you can modify it according to your convenience.
5) You have the option to hide or show a LABEL at the top of the chart, with respect to the signals: BULLISH green, BEARISH red. *
6) You have the option to hide or show INDICATORS or SIGNALS based on EACH OSCILLATION .
Main performance functions of this modified indicator:
I) In the case of the PERFORMANCE that appears at the right of the chart, you have the option to adjust the WIDTH of each box.
II) The TEXT of the PERFORMANCE is not modifiable, but you can customize the default color. *
III) The BACKGROUND of the PERFORMANCE , you can customize the default color. *
IV) You have the option to hide or show a PERFORMANCE that appears at the right of the chart.
Main functions to customize the style of this indicator:
a) For any type of SIGNAL , it is painted as a VERTICAL LINE in the graph, you can change the color that comes by default. *
b) In the case of the LABELS that appear at the top, the text is not modifiable, but you can customize both the type of label and change the default color. *
c) When you have a SHORT SIGNAL or a LONG SIGNAL , you can change the EMOTICON that comes by default. **
* By default, they are marked as red for downtrends and green for uptrends.
** By default, they are marked with an emoticon indicating the possible direction of the price, down if it is bearish or up if it is bullish .
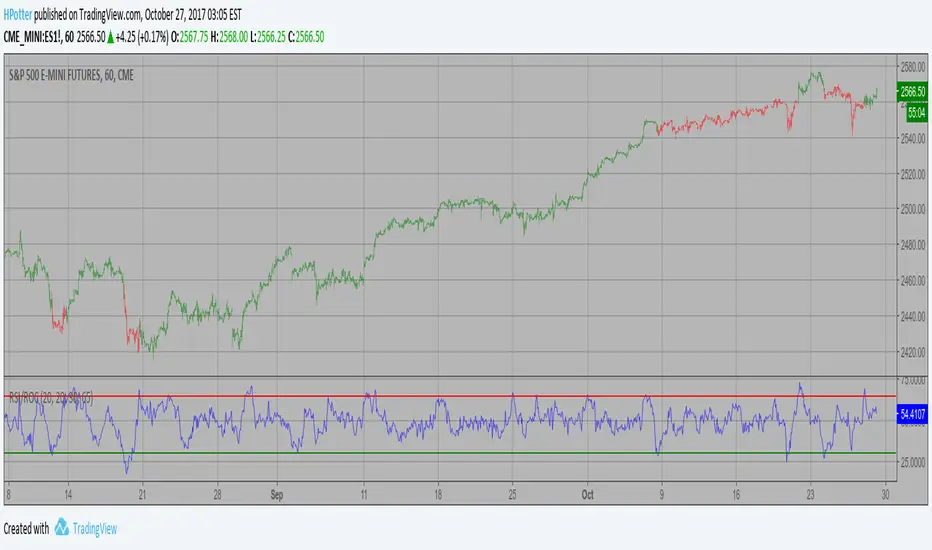
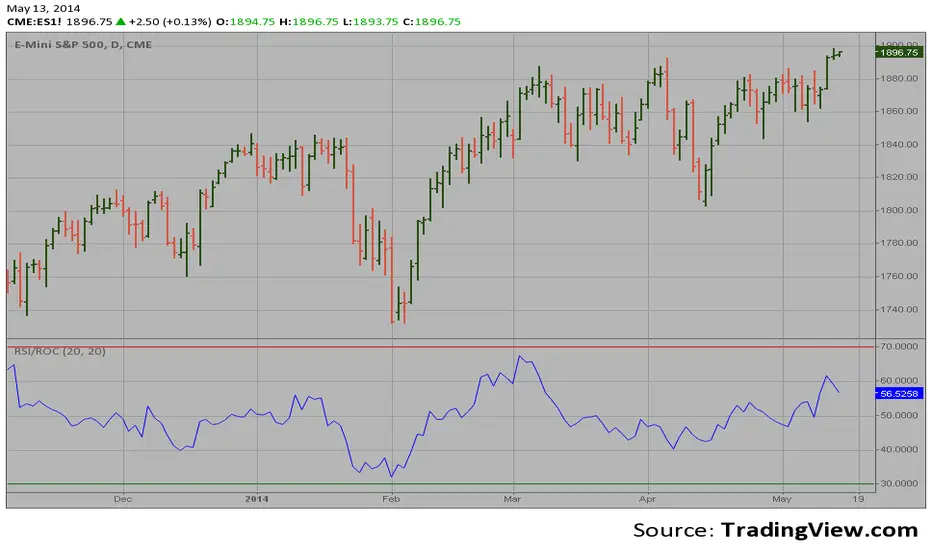
RSI based on ROC Strategy This is the new-age indicator which is version of RSI calculated upon
the Rate-of-change indicator.
The name "Relative Strength Index" is slightly misleading as the RSI
does not compare the relative strength of two securities, but rather
the internal strength of a single security. A more appropriate name
might be "Internal Strength Index." Relative strength charts that compare
two market indices, which are often referred to as Comparative Relative Strength.
And in its turn, the Rate-of-Change ("ROC") indicator displays the difference
between the current price and the price x-time periods ago. The difference can
be displayed in either points or as a percentage. The Momentum indicator displays
the same information, but expresses it as a ratio.
WARNING:
- This script to change bars colors.
RSI based on ROC This is the new-age indicator which is version of RSI calculated upon
the Rate-of-change indicator.
The name "Relative Strength Index" is slightly misleading as the RSI
does not compare the relative strength of two securities, but rather
the internal strength of a single security. A more appropriate name
might be "Internal Strength Index." Relative strength charts that compare
two market indices, which are often referred to as Comparative Relative Strength.
And in its turn, the Rate-of-Change ("ROC") indicator displays the difference
between the current price and the price x-time periods ago. The difference can
be displayed in either points or as a percentage. The Momentum indicator displays
the same information, but expresses it as a ratio.
Ludvig Indicator PROThe Ludvig Indicator is designed to identify high-probability breakout setups by combining trend, volume, volatility, and relative strength filters. It helps you enter stocks (or ETFs/crypto) when institutional money is likely flowing in, while avoiding false breakouts and weak trends.
🔑 Core Features
Zero-Lag EMA (ZLEMA)
Faster, less lagging trend detection compared to traditional EMAs.
Used as the basis for dynamic ATR bands.
ATR Volatility Bands
Adaptive bands based on the Average True Range (ATR).
Define the zone where price must close outside to confirm trend strength.
Breakout Confirmation
Requires price to close above recent highs (lookback configurable).
Ensures signals are “true breakouts,” not just noise around moving averages.
Volume Filter (Relative Volume)
Validates breakouts with significantly higher volume than average.
Prevents low-liquidity signals from triggering.
Trend Strength (ADX)
Built-in ADX calculation ensures only strong, trending moves are considered.
Default filter: ADX ≥ 18 (configurable).
Relative Strength vs. Benchmark
Compares the asset’s momentum against a benchmark (default: SPY).
Only signals when the asset is outperforming the benchmark.
Useful for sector rotation and picking leaders instead of laggards.
Alerts & Signals
Breakout entries are marked with small green triangles.
Built-in alerts for automated notifications (TradingView alerts).

ROC | QuantumResearch🔍 QuantumResearch ROC Screener
The QuantumResearch ROC Screener is an advanced multi-asset momentum analyzer designed to track relative strength across up to 11 user-defined assets using Rate of Change (ROC). This tool helps traders identify outperformers, underperformers, and rotation opportunities in fast-moving markets.
🧠 How It Works
This screener systematically calculates the Rate of Change (ROC) for each selected asset using two perspectives:
Absolute ROC – Measures the momentum of each asset individually over the chosen lookback period.
Relative ROC Matrix – Compares each asset against every other asset (e.g., BTC vs ETH, ETH vs SOL, etc.) using pairwise ROC ratios.
These values are organized into a dynamic heatmap-style table, highlighting which assets exhibit the strongest directional moves and relative strength. The script also includes:
Averages across all relative pairs to rank each asset.
Color-coded visuals to identify bullish (green), bearish (red), and neutral (white) ROC values.
📊 Main Features
🔢 Up to 11 Assets: Choose any combination of crypto, forex, indices, or commodities.
💡 Pairwise Comparison Matrix: Visualizes each asset’s ROC vs every other asset.
📈 Momentum Ranking: Assets are sorted based on their total average ROC score.
🎨 Color-Coded Table: Makes it easy to spot high or low momentum tokens at a glance.
⚙️ Custom ROC Period: Choose the length of the momentum window.
🧩 Flexible Layout: Position the table anywhere on your screen and adjust font size.
✅ How to Use It
Select your favorite 11 assets (e.g., BTC, ETH, SOL, etc.).
Adjust the ROC length to capture short-term or medium-term momentum.
Spot top trending assets.
Identify reversals or breakouts.
Build rotational or relative strength strategies.
⚠️ Important Notes
Momentum is a powerful tool, but context matters — combine ROC readings with your broader strategy (trend, liquidity, valuation).
This screener is not predictive — it reflects past performance over a defined lookback window.
📉 Disclaimer
Past performance is not indicative of future results. This tool is designed to provide data-driven insight, not financial advice. Always conduct your own research and apply proper risk management.

Range Breakout [sgbpulse]Range Breakout
1. Overview
The "Range Breakout " indicator is a powerful tool designed to identify and visually display price ranges on your chart using pivot points. It dynamically draws two distinct boxes – an External Range and an Internal Range – helping traders pinpoint potential support and resistance zones. Beyond its visual representation, the indicator offers a comprehensive set of 12 unique breakout alerts, providing real-time notifications for significant price movements outside these defined ranges. Additionally, it integrates RSI and MFI metrics for momentum confirmation.
2. How It Works
The indicator operates by identifying pivot points based on user-defined "left" and "right" bar lengths. A high pivot is a bar with a specified number of lower highs both to its left and right, and similarly for a low pivot.
External Range: Calculated using longer pivot lengths (default: 15 bars left, 6 bars right). This range represents broader, more significant price consolidation areas.
Internal Range: Calculated using shorter pivot lengths (default: 4 bars left, 3 bars right). This range captures tighter, more immediate price consolidations within the broader trend.
The External Range will always be greater than or equal to the Internal Range, as it's based on a wider historical context. Both ranges are displayed as transparent boxes on your chart, dynamically adjusting as new pivots are formed.
3. Key Features and Settings
Customizable Pivot Lengths:
External Range (Left/Right Bars): Adjust sensitivity for identifying the broader price range. Longer lengths lead to more stable, but less frequent, range updates.
Internal Range (Left/Right Bars): Adjust sensitivity for the tighter, more immediate price range.
Tool Tips: Minimum 6 bars for the External Range, and minimum 2 bars for the Internal Range.
Customizable Range Colors: Easily change the background colors of the External and Internal Range boxes to match your chart's aesthetic.
Dynamic Range Display: The indicator automatically updates the range boxes as new pivot highs and lows are formed, always presenting the most current valid ranges.
RSI / MFI Settings:
Timeframe Source: Select the timeframe for RSI and MFI calculation.
- Chart: Calculation based on the current chart timeframe.
- Daily: Always calculated based on the daily ("D") timeframe, even if the chart is on a lower timeframe.
RSI Length: Period length for RSI calculation (default: 14).
RSI Overbought Level: Overbought level for RSI (default: 70.0).
RSI Oversold Level: Oversold level for RSI (default: 30.0).
MFI Length: Period length for MFI calculation (default: 14).
MFI Overbought Level: Overbought level for MFI (default: 80.0).
MFI Oversold Level: Oversold level for MFI (default: 20.0).
4. Synergy of Ranges & Breakout Strength
The interaction between the External and Internal Ranges provides deep insights into price movement and breakout strength:
Immediate Direction: The movement of the Internal Range (up or down) indicates the short-term directional bias within the broader framework of the External Range.
Strength Confirmation: A breakout of the External Range, followed by a breakout of the Internal Range, confirms the strength of the move and increases confidence in the breakout.
Strong Momentum ("Leaving" Ranges Behind): When price breaks out with exceptionally strong momentum, it continues to move aggressively and does not immediately form new pivots. In such situations, the existing ranges (External and Internal) remain in place while the candles "leave them behind." A "Full Candle" breakout, where the entire candle moves past both ranges, indicates a particularly powerful and decisive move.
Momentum (RSI / MFI) as Confirmation:
- RSI (Relative Strength Index): Measures the speed and change of price movements. Extreme values (above 70 or below 30) indicate overbought/oversold conditions respectively, confirming strong momentum in a breakout.
- MFI (Money Flow Index): Similar to RSI but incorporates volume. Extreme values (above 80 or below 20) indicate strong money flow in/out, reinforcing breakout confirmation.
- Importance of Confirmation: If a breakout occurs but momentum indicators do not confirm it (for example, an upside breakout while RSI is declining), this could signal weakness in the move and the risk of a false breakout (Fakeout).
5. Visuals
The indicator provides clear visual representations on the chart:
Range Boxes:
Two dynamic boxes are drawn on the chart: one for the External Range and one for the Internal Range.
These boxes update continuously, displaying the current range boundaries based on the latest pivots. They provide an immediate visual indication of support and resistance levels.
RSI/MFI Status Labels:
Small text labels appear to the right of the current bar, vertically centered.
They display the status of RSI and MFI: RSI OB (Overbought), RSI OS (Oversold), MFI OB, MFI OS, along with the exact value.
Important: The labels remain on the chart as long as the condition holds (indicator is above/below the level), unlike alerts which mark a singular crossover event.
Plotting of Key Values:
The indicator plots six invisible series on the chart, primarily to allow the user to view the exact numerical values of:
- The upper and lower bounds of the External Range (External High, External Low).
- The upper and lower bounds of the Internal Range (Internal High, Internal Low).
- The calculated RSI and MFI values (RSI, MFI).
These values are accessible for viewing through TradingView's Data Window and also via the Status Line when hovering over the relevant candle. This enables more precise quantitative analysis of range levels and momentum.
6. Comprehensive Breakout Alerts
The "Range Breakout " indicator provides 12 distinct alert conditions for breakouts, allowing you to select the required level of confirmation for each alert. All alerts are triggered only upon a fully confirmed bar close (barstate.isconfirmed) to minimize false signals and ensure reliability.
All breakout alerts are configured to detect a Crossover/Crossunder of the levels, meaning a specific event where the price moves from one side of the range to the other.
External Range Breakout UP
- Close: Price closes above the External Range.
- Real Body: The entire "real body" of the candle (min of open/close prices) closes above the External Range.
- Full Candle: The entire candle (the lowest point of the candle) closes above the External Range.
External Range Breakout DOWN
- Close: Price closes below the External Range.
- Real Body: The entire "real body" of the candle (max of open/close prices) closes below the External Range.
- Full Candle: The entire candle (the highest point of the candle) closes below the External Range.
Internal Range Breakout UP
- Close: Price closes above the Internal Range.
- Real Body: The "real body" of the candle closes above the Internal Range.
- Full Candle: The entire candle closes above the Internal Range.
Internal Range Breakout DOWN
- Close: Price closes below the Internal Range.
- Real Body: The "real body" of the candle closes below the Internal Range.
- Full Candle: The entire candle closes below the Internal Range.
7. Ideal Use Cases
This indicator is ideal for traders who:
Want to clearly identify and monitor price consolidation zones.
Seek confirmation for breakout strategies across various timeframes.
Require reliable and automated alerts for potential entry or exit points based on range expansion.
8. Complementary Indicator
For even more comprehensive market analysis, we highly recommend using this indicator in conjunction with Market Structure Support & Resistance External/Internal & BoS .
This powerful complementary indicator automatically and accurately identifies significant support and resistance levels by locating high and low pivot points, as well as key Pre-Market High/Low levels. Its strength lies in its dynamic adaptability to any timeframe and asset, providing precise and relevant real-time levels while maintaining a clean chart. It also identifies Break of Structure (BoS) to signal potential trend changes or continuations.
Using both indicators together provides a robust framework for identifying defined ranges and potential trend shifts, enabling more informed trading decisions.
View Market Structure Support & Resistance External/Internal & BoS Indicator
9. Important Note: Trading Risk
This indicator is intended for educational and informational purposes only and does not constitute investment advice or a recommendation for trading in any form whatsoever.
Trading in financial markets involves significant risk of capital loss. It is important to remember that past performance is not indicative of future results. All trading decisions are your sole responsibility. Never trade with money you cannot afford to lose.

Mariam Market DashboardMariam Market Dashboard – A Quick Guide
Purpose:
Shows if the market is trending, volatile, or stuck so you can decide when to trade or wait.
How to Use
Add the indicator to your chart. Adjust basic settings like EMA, RSI, ATR lengths, and timezone if needed. Use it before entering any trade to confirm market conditions.
What Each Metric Means (with general ranges)
Session: Identifies which market session is active (New York, London, Tokyo).
Trend: Shows current market direction. “Up” means price above EMA and VWAP, “Down” means price below. Use this to confirm bullish or bearish bias.
HTF Trend: Confirms trend on a higher timeframe for stronger signals.
ATR (Average True Range): Measures market volatility or price movement speed.
Low ATR (e.g., below 0.5% of price) means quiet or slow market; high ATR (above 1% of price) means volatile or fast-moving market, good for active trades.
Strong Bar: A candlestick closing near its high (above 75% of range) indicates strong buying momentum; closing near its low indicates strong selling momentum.
Higher Volume: Volume higher than average (typically 10-20% above normal) means more market activity and stronger moves.
Volume / Avg Volume: Ratio above 1.2 (120%) shows volume is significantly higher than usual, signaling strong interest.
RVol % (Relative Volume %): Above 100% means volume is hotter than normal, increasing chances of strong moves; below 50% means low activity and possible indecision.
Delta: Difference between buying and selling volume (if available). A positive delta means buyers dominate; negative means sellers dominate.
ADX (Average Directional Index): Measures trend strength:
Below 20 means weak or no trend;
Above 25 means strong trend;
Between 20-25 is moderate trend.
RSI (Relative Strength Index): Momentum oscillator:
Below 30 = oversold (potential buy);
Above 70 = overbought (potential sell);
Between 40-60 means neutral momentum.
MACD: Confirms momentum direction:
Positive MACD histogram bars indicate bullish momentum;
Negative bars indicate bearish momentum.
Choppiness Index: Measures how much the market is ranging versus trending:
Above 60 = very choppy/sideways market;
Below 40 = trending market.
Consolidation: When true, price is stuck in a narrow range, signaling indecision. Avoid breakout trades during this.
Quick Trading Reminder
Trade only when the trend is clear and volume is above average. Avoid trading in low volume or choppy markets.

Order Block Matrix [Alpha Extract]The Order Block Matrix indicator identifies and visualizes key supply and demand zones on your chart, helping traders recognize potential reversal points and high-probability trading setups.
This tool helps traders:
Visualize key order blocks with volume profile histograms showing liquidity distribution.
Identify high-volume price levels where institutional activity occurs.
rank historical order blocks and analyze their strength based on volume.
Receive alerts for potential trading opportunities based on price-block interactions.
🔶 CALCULATION
The indicator processes chart data to identify and analyze order blocks:
Order Block Detection
Inputs:
Price action patterns (consolidation areas followed by breakouts).
Volume data from current and lower timeframes.
User-defined lookback periods and thresholds.
Detection Logic:
Identifies consolidation areas using a dynamic range comparison.
Confirms breakout patterns with percentage threshold validation.
Maps volume distribution across price levels within each order block.
🔶Volume Analysis
Volume Profiling:
Divides each order block into configurable grid segments.
Maps volume distribution across price segments within blocks.
Highlights zones with highest volume concentration.
Strength Assessment:
Calculates total block volume and relative strength metrics.
Compares block volume to historical averages.
Determines probability of reversal based on volume patterns.
isConsolidation(len) =>
high_range = ta.highest(high, len) - ta.lowest(high, len)
low_range = ta.highest(low, len) - ta.lowest(low, len)
avg_range = (high_range + low_range) / 2
current_range = high - low
current_range <= avg_range * (1 + obThreshold)
🔶 DETAILS
Visual Features
Volume Profile Histograms:
Color-coded bars showing volume concentration within order blocks.
Gradient coloring based on relative volume (high volume = brighter colors).
Bull blocks (green/teal) and bear blocks (red) with varying opacity.
Block Visualization:
Dynamic box sizing based on volume concentration.
Optional block borders and background fills.
Volume labels showing total block volume.
Screener Table:
Real-time analysis of order block metrics.
Shows block direction, proximity, retest count, and volume metrics.
Color-coded for quick reference.
Interpretation
High Volume Areas: Zones with institutional interest and potential reversal points.
Block Direction: Bullish blocks typically support price, bearish blocks typically resist price.
Retests: Multiple tests of an order block may strengthen or weaken its influence.
Block Age: Newer blocks often have stronger influence than older ones.
Volume Concentration: Brightest segments within blocks represent the highest volume areas.
🔶 EXAMPLES
The indicator helps identify key trading opportunities:
Bullish Order Blocks
Support Zones: Identify strong support levels where price is likely to bounce.
Breakout Confirmation: Validate breakouts with volume analysis to avoid false moves.
Retest Strategies: Enter trades when price retests a bullish order block with high volume.
Bearish Order Blocks
Resistance Zones: Identify strong resistance levels where price is likely to reverse.
Distribution Areas: Detect zones where smart money is distributing to retail.
Short Opportunities: Find optimal short entry points at high-volume bearish blocks.
Combined Strategies
Order Block Stacking: Multiple aligned blocks create stronger support/resistance zones.
Block Mitigation: When price breaks through a block, it often indicates a strong trend continuation.
Volume Profile Applications: Higher volume segments provide more precise entry and exit points.
🔶 SETTINGS
Customization Options
Order Block Detection:
Consolidation Lookback: Adjust the period for consolidation detection.
Breakout Threshold: Set minimum percentage for breakout confirmation.
Historical Lookback Limit: Control how far back to scan for historical order blocks.
Maximum Order Blocks: Limit the number of visible blocks on the chart.
Visual Style:
Grid Segments: Adjust the number of volume profile segments.
Extend Blocks to Right: Enable/disable extending blocks to current price.
Show Block Borders: Toggle border visibility.
Border Width: Adjust thickness of block borders.
Show Volume Text: Enable/disable volume labels.
Volume Text Position: Control placement of volume labels.
Color Settings:
Bullish High/Low Volume Colors: Customize appearance of bullish blocks.
Bearish High/Low Volume Colors: Customize appearance of bearish blocks.
Border Color: Set color for block outlines.
Background Fill: Adjust color and transparency of block backgrounds.
Volume Text Color: Customize label appearance.
Screener Table:
Show Screener Table: Toggle table visibility.
Table Position: Select positioning on the chart.
Table Size: Adjust display size.
The Order Block Matrix indicator provides traders with powerful insights into market structure, helping to identify key levels where smart money is active and where high-probability trading opportunities may exist.

Multiple (12) Strong Buy/Sell Signals + Momentum
Indicator Manual: "Multiple (12) Strong Buy/Sell Signals + Momentum"
This indicator is designed to identify strong buy and sell signals based on 12 configurable conditions, which include a variety of technical analysis methods such as trend-following indicators, pattern recognition, volume analysis, and momentum oscillators. It allows for customizable alerts and visual cues on the chart. The indicator helps traders spot potential entry and exit points by displaying buy and sell signals based on the selected conditions.
Key Observations:
• The script integrates multiple indicators and pattern recognition methods to provide comprehensive buy/sell signals.
• Trend-based indicators like EMAs and MACD are combined with pattern recognition (flags, triangles) and momentum-based signals (RSI, ADX, and volume analysis).
• User customization is a core feature, allowing adjustments to the conditions and thresholds for more tailored signals.
• The script is designed to be responsive to market conditions, with multiple conditions filtering out noise to generate reliable signals.
________________________________________
Key Features:
1. 12 Combined Buy/Sell Signal Conditions: This indicator incorporates a diverse set of conditions based on trend analysis, momentum, and price patterns.
2. Minimum Conditions Input: You can adjust the threshold of conditions that need to be met for the buy/sell signals to appear.
3. Alert Customization: Set alert thresholds for both buy and sell signals.
4. Dynamic Visualization: Buy and sell signals are shown as triangles on the chart, with momentum signals highlighted as circles.
________________________________________
Detailed Description of the 12 Conditions:
1. Exponential Moving Averages (EMA):
o Conditions: The indicator uses EMAs with periods 3, 8, and 13 for quick trend-following signals.
o Bullish Signal: EMA3 > EMA8 > EMA13 (Bullish stack).
o Bearish Signal: EMA3 < EMA8 < EMA13 (Bearish stack).
o Reversal Signal: The crossing over or under of these EMAs can signify trend reversals.
2. MACD (Moving Average Convergence Divergence):
o Fast MACD (2, 7, 3) is used to confirm trends quickly.
o Bullish Signal: When the MACD line crosses above the signal line.
o Bearish Signal: When the MACD line crosses below the signal line.
3. Donchian Channel:
o Tracks the highest high and lowest low over a given period (default 20).
o Breakout Signal: Price breaking above the upper band is bullish; breaking below the lower band is bearish.
4. VWAP (Volume-Weighted Average Price):
o Above VWAP: Bullish condition (price above VWAP).
o Below VWAP: Bearish condition (price below VWAP).
5. EMA Stacking & Reversal:
o Tracks the order of EMAs (3, 8, 13) to confirm strong trends and reversals.
o Bullish Reversal: EMA3 < EMA8 < EMA13 followed by a crossing to bullish.
o Bearish Reversal: EMA3 > EMA8 > EMA13 followed by a crossing to bearish.
6. Bull/Bear Flags:
o Bull Flag: Characterized by a strong price movement (flagpole) followed by a pullback and breakout.
o Bear Flag: Similar to Bull Flag but in the opposite direction.
7. Triangle Patterns (Ascending and Descending):
o Detects ascending and descending triangles using pivot highs and lows.
o Ascending Triangle: Higher lows and flat resistance.
o Descending Triangle: Lower highs and flat support.
8. Volume Sensitivity:
o Identifies price moves with significant volume increases.
o High Volume: When current volume is significantly above the moving average volume (set to 1.2x of the average).
9. Momentum Indicators:
o RSI (Relative Strength Index): Confirms overbought and oversold levels with thresholds set at 65 (overbought) and 35 (oversold).
o ADX (Average Directional Index): Confirms strong trends when ADX > 28.
o Momentum Up: Momentum is upward with strong volume and bullish RSI/ADX conditions.
o Momentum Down: Momentum is downward with strong volume and bearish RSI/ADX conditions.
10. Bollinger & Keltner Squeeze:
o Squeeze Condition: A contraction in both Bollinger Bands and Keltner Channels indicates low volatility, signaling a potential breakout.
o Squeeze Breakout: Price breaking above or below the squeeze bands.
11. 3 Consecutive Candles Condition:
o Bullish: Price rises for three consecutive candles with higher highs and lows.
o Bearish: Price falls for three consecutive candles with lower highs and lows.
12. Williams %R and Stochastic RSI:
o Williams %R: A momentum oscillator with signals when the line crosses certain levels.
o Stochastic RSI: Provides overbought/oversold levels with smoother signals.
o Combined Signals: You can choose whether to require both WPR and StochRSI to signal a buy/sell.
________________________________________
User Inputs (Inputs Tab):
1. Minimum Conditions for Buy/Sell:
o min_conditions: Number of conditions required to trigger a buy/sell signal on the chart (1 to 12).
o Alert_min_conditions: User-defined alert threshold (how many conditions must be met before an alert is triggered).
2. Donchian Channel Settings:
o Show Donchian: Toggle visibility of the Donchian channel.
o Donchian Length: The length of the Donchian Channel (default 20).
3. Bull/Bear Flag Settings:
o Bull Flag Flagpole Strength: ATR multiplier to define the strength of the flagpole.
o Bull Flag Pullback Length: Length of pullback for the bull flag pattern.
o Bull Flag EMA Length: EMA length used to confirm trend during bull flag pattern.
Similar settings exist for Bear Flag patterns.
4. Momentum Indicators:
o RSI Length: Period for calculating the RSI (default 9).
o RSI Overbought: Overbought threshold for the RSI (default 65).
o RSI Oversold: Oversold threshold for the RSI (default 35).
5. Bollinger/Keltner Squeeze Settings:
o Squeeze Width Threshold: The maximum width of the Bollinger and Keltner Bands for squeeze conditions.
6. Stochastic RSI Settings:
o Stochastic RSI Length: The period for calculating the Stochastic RSI.
7. WPR Settings:
o WPR Length: Period for calculating Williams %R (default 14).
________________________________________
User Inputs (Style Tab):
1. Signal Plotting:
o Control the display and colors of the buy/sell signals, momentum indicators, and pattern signals on the chart.
o Buy/Sell Signals: Can be customized with different colors and shapes (triangle up for buys, triangle down for sells).
o Momentum Signals: Custom circle placement for momentum-up or momentum-down signals.
2. Donchian Channel:
o Show Donchian: Toggle visibility of the Donchian upper, lower, and middle bands.
o Band Colors: Choose the color for each band (upper, lower, middle).
________________________________________
How to Use the Indicator:
1. Adjust Minimum Conditions: Set the minimum number of conditions that must be met for a signal to appear. For example, set it to 5 if you want only stronger signals.
2. Set Alert Threshold: Define the number of conditions needed to trigger an alert. This can be different from the minimum conditions for visual signals.
3. Customize Appearance: Modify the colors and styles of the signals to match your preferences.
________________________________________
Conclusion:
This comprehensive trading indicator uses a combination of trend-following, pattern recognition, and momentum-based conditions to help you spot potential buy and sell opportunities. By adjusting the input settings, you can fine-tune it to match your specific trading strategy, making it a versatile tool for different market conditions.
Signal Reliability Based on Condition Count
The reliability of the buy/sell signals increases as more conditions are met. Here's a breakdown of the probabilities:
1. 1-3 Conditions Met: Lower Probability
o Signals that meet only 1-3 conditions tend to have lower reliability and are considered less probable. These signals may represent false positives or weaker market movements, and traders should approach them with caution.
2. 4 Conditions Met: More Reliable Signal
o When 4 conditions are met, the signal becomes more reliable. This indicates that multiple indicators or market patterns are aligning, increasing the likelihood of a valid buy/sell opportunity. While not foolproof, it's a stronger indication that the market may be moving in a particular direction.
3. 5-6 Conditions Met: Strong Signal
o A signal meeting 5-6 conditions is considered a strong signal. This indicates a well-confirmed move, with several technical indicators and market factors aligning to suggest a higher probability of success. These are the signals that traders often prioritize.
4. 7+ Conditions Met: Rare and High-Confidence Signal
o Signals that meet 7 or more conditions are rare and should be considered high-confidence signals. These represent a significant alignment of multiple factors, and while they are less frequent, they are highly reliable when they do occur. Traders can be more confident in acting on these signals, but they should still monitor market conditions for confirmation.
________________________________________
You can adjust the number of conditions as needed, but this breakdown should give a clear structure on how the signal strength correlates with the number of conditions met!

Swing Trade TarayıcıSwing Trade Scanner (v6) User Guide
1. Purpose:
This TradingView indicator (written in Pine Script v6) is designed to help identify swing trading opportunities. It calculates an overall trend strength and direction score by combining multiple technical analyses for up to 20 financial assets (stocks, cryptocurrencies, forex, etc.) that you specify. It presents the results in a customizable table, allowing you to quickly scan the market.
2. Analyses Used and Their Roles:
By default, the indicator uses the following 4 main technical analyses:
EMA Crossover (Default: 9/21): Used to capture short-term trend direction and potential momentum shifts. When the fast EMA (9) crosses above the slow EMA (21), it's considered a bullish signal; when it crosses below, it's a bearish signal. It's often one of the main entry/exit triggers.
RSI (Relative Strength Index - Default: 14): Measures the speed of price movements to identify overbought (OB) and oversold (OS) conditions. Reversals from the OB zone can signal potential downturns, while reversals from the OS zone can signal potential upturns. It also provides insight into the strength of the momentum.
MACD (Moving Average Convergence Divergence - Default: 12, 26, 9): A trend-following momentum indicator. The relationship between the MACD line and the signal line (crossovers) and the state of the histogram (position relative to the zero line) are used to confirm momentum shifts and trend strength.
ADX/DI (Average Directional Index - Default: 14, 14): Measures the strength (ADX) and direction (+DI/-DI lines) of a trend. Its main role is to filter signals from other indicators. A trend is considered to exist if the ADX is above a certain threshold (e.g., 25). +DI above -DI indicates an uptrend, and the reverse indicates a downtrend.
3. Scoring System:
The indicator calculates an individual score for each analysis and then combines these scores using weights you define to create a final Trend Score:
Individual Scores: Each analysis (EMA, RSI, MACD, ADX/DI) generates a decimal score between -1.0 (Strong Negative/Bearish) and +1.0 (Strong Positive/Bullish) based on its own rules. For example, RSI might score +1.0 if oversold, -1.0 if overbought, and 0.0 if neutral. MACD and ADX/DI scores can also take intermediate values reflecting both direction and strength (e.g., ±1.0, ±0.6, ±0.3, 0.0).
Weighting: In the settings, you can assign a weight (between 0.0 and 1.0) to each analysis, determining how much it influences the final score. For instance, you might give EMA crossover a higher weight and use RSI with a lower weight.
Total Score: The individual scores of the active analyses are multiplied by their assigned weights and summed up. This total is then divided by the sum of the weights of the active analyses to obtain a final, normalized Trend Score between -1.0 and +1.0. This score represents the combined view of all analyses.
4. Trend Determination:
The calculated final Trend Score is classified into an overall TREND status based on threshold values you set in the settings:
S.UP (Strong Up): Score > Strong Up Threshold (Default: 0.70)
UP: Up Threshold < Score <= Strong Up Threshold (Default: 0.35 < Score <= 0.70)
NEUTRAL: Down Threshold <= Score <= Up Threshold (Default: -0.35 <= Score <= 0.35)
DOWN: Strong Down Threshold <= Score < Down Threshold (Default: -0.70 <= Score < -0.35)
S.DOWN (Strong Down): Score < Strong Down Threshold (Default: -0.70)
This classification allows you to see at a glance which assets have strong trend potential.
5. Table Structure and Meanings:
The indicator displays the results in a table with the following columns:
TICKER: The symbol of the analyzed asset (abbreviated).
TREND: The overall trend status determined by the total score (S.UP, UP, NEUTRAL, DOWN, S.DOWN). The background color of this column also reflects this overall trend (Dark Green, Green, Gray, Red, Dark Red).
SCORE: The calculated weighted total score (between -1.00 and +1.00, with two decimal places). The background color of this column also reflects the overall trend.
EMA: Shows the result of only the EMA 9/21 analysis.
▲: EMA(9) > EMA(21) (Green Background)
▼: EMA(9) < EMA(21) (Red Background)
N: Neutral (Gray Background)
-: Analysis disabled or no data (Pale Gray Background)
RSI: Shows the result of only the RSI analysis.
OS: Oversold (RSI < 30) (Green Background)
M+: Mid Positive (30 <= RSI < 45) (Light Green/Lime Background)
N: Neutral (45 <= RSI <= 55) (Gray Background)
M-: Mid Negative (55 < RSI <= 70) (Orange Background)
OB: Overbought (RSI > 70) (Red Background)
-: Analysis disabled or no data (Pale Gray Background)
MACD: Shows the result of only the MACD analysis.
S+: Strong Positive (MACD > Signal AND Histogram > 0) (Green Background)
M+: Mid Positive (MACD > Signal BUT Histogram < 0) (Light Green/Lime Background)
N: Neutral (Other cases) (Gray Background)
M-: Mid Negative (MACD < Signal BUT Histogram > 0) (Orange Background)
S-: Strong Negative (MACD < Signal AND Histogram < 0) (Red Background)
-: Analysis disabled or no data (Pale Gray Background)
ADX/DI: Shows the result of only the ADX/DI analysis.
S+: Strong Uptrend (ADX > 40 AND +DI > -DI) (Green Background)
M+: Mid Uptrend (25 < ADX <= 40 AND +DI > -DI) (Light Green/Lime Background)
W: Weak Trend (ADX <= 25) (Gray Background)
M-: Mid Downtrend (25 < ADX <= 40 AND -DI > +DI) (Orange Background)
S-: Strong Downtrend (ADX > 40 AND -DI > +DI) (Red Background)
-: Analysis disabled or no data (Pale Gray Background)
6. Settings (Inputs):
You can customize the indicator's behavior using the following settings:
General Settings:
Analysis Timeframe: Select the timeframe for the scans (Leave blank to use the chart timeframe).
Auto Adjust Parameters and Weights: If checked, predefined parameters and weights based on the selected timeframe (1h, 4h, 1D, 1W) are used. If unchecked, or if an unsupported timeframe is selected, the manual settings below apply.
Strong/Normal Up/Down Thresholds: Adjust the score thresholds used to determine the TREND column.
Analysis Settings (Separate Group for Each Analysis):
Enable ... Analysis: Check to include the respective analysis in the score.
... Weight (Manual): If auto-adjust is off, set the weight of this analysis in the total score.
... Period/Level (Manual): If auto-adjust is off, adjust the parameters (period, level, etc.) of the respective indicator.
Symbols (1-10):
Checkbox: Check to include the respective symbol in the scan.
Text Box: Enter the symbol of the asset you want to analyze (e.g., "NASDAQ:AAPL", "BINANCE:BTCUSDT").
Table Settings:
Table Position: Choose where the table appears on the chart.
Cell Width: Adjust the width of the table cells.
Text Size: Select the general size of the text in the table (individual analysis columns are usually shown one size smaller).
7. How to Use:
Add the indicator to your TradingView chart.
Enter the indicator settings.
In the Symbols section, enter the symbols of the assets you want to analyze and check the boxes next to them.
In the General Settings section, select your desired Analysis Timeframe.
Decide whether the Auto Adjust Parameters and Weights option should be checked. If not, adjust the manual parameters and weights for each indicator in the Analysis Settings section according to your strategy.
Examine the table:
The TREND and SCORE columns give you a general overview. Focus on strong signals (S.UP, S.DOWN) or states that have just crossed thresholds (UP, DOWN).
The EMA, RSI, MACD, ADX/DI columns allow you to see in detail which analyses influenced the overall score. You can track confirming or conflicting signals here.
Combine these scan results with other rules of your swing trading strategy (support/resistance, patterns, risk management, etc.) to make trading decisions.
8. Important Notes:
This indicator does not constitute financial advice. It is merely a tool that combines technical analysis tools to help you scan the market.
The default parameters and weights in the indicator settings are for general use. For best results, it is strongly recommended that you optimize these settings by backtesting them on historical data according to your own strategy, the assets you trade, and market conditions.
No technical indicator or system generates 100% accurate signals. Always apply risk management principles and do not trade with money you cannot afford to lose.
I hope this guide helps you use the indicator effectively!

Altcoin Screener | QuantumResearchAltcoin Screener | QuantumResearch
🔍 Multi-Factor Asset Ranking & Portfolio Allocator for Altcoins
This screener is an advanced tool designed to help crypto investors identify the strongest-performing altcoins among a custom selection of up to 40 assets. It evaluates multiple factors across trend strength, momentum, relative performance, and risk-adjusted returns — then allocates a portfolio accordingly.
🔬 How it Works:
Each altcoin is scored using a blend of custom-built indicators developed by QuantumResearch:
Beta (volatility relative to BTC) – Measures how much an asset moves compared to Bitcoin. Higher beta = higher volatility.
Alpha – Measures the asset’s excess return versus Bitcoin (BTC is the required benchmark for this model).
ARSI – Adaptative RSI signal score to determine directional strength.
AVWO – Adaptative Volume-weighted momentum oscillator detecting momentum
Uni1 – Universal algorithme 1
Uni2 – Universal algorithme 2
7D ROC – 7-day rate of change (short-term momentum).
Relative Strength Matrix – Evaluates price ratio behavior between all selected assets.
Omega Ratio – A refined risk/reward filter favoring stable upside.
All scores are aggregated into a Final Score, which determines each token’s overall rank in the current environment.
⚠️ Important Requirements:
This script must be applied to the BTCor TOTAL chart, as BTC/TOTAL is used as the benchmark to compute accurate Beta and Alpha values.
All selected assets must have at least 300 bars of price history to ensure the filters function properly (especially for Alpha, Beta, and Omega computations).
💼 Portfolio Allocation Modes:
Choose how you'd like to allocate based on your risk preference:
🧠 Conservative → Top 3 assets (50% / 30% / 20%)
⚖️ Mix → Top 2 assets (80% / 20%)
🔥 Aggressive → Top 1 asset (100%)
The result is a simple and powerful table showing your top allocations, backed by sound multi-factor analysis.
📊 Key Features:
Supports up to 40 customizable assets from any exchange
Displays performance stats like Beta, Alpha, and Omega
Color-coded tables highlight winners, metrics, and risk zones
Automatically updates allocation tables based on rankings
View mean & median values for deeper benchmarking
🧠 Use Cases:
Build a custom altcoin portfolio with solid statistical backing
Identify strong trends early with momentum + ratio blend
Visualize volatility and risk-adjusted strength versus BTC
Allocate based on signals, not social hype
🔧 Built by QuantumResearch
📈 Engineered for strategic signal discovery
⚠️ For research and educational purposes only — not financial advice.

Volume-RSI Colored Bars
The Volume Indicator, used in conjunction with the embedded Relative Strength Index (RSI), is a powerful tool for making informed trading decisions. Let’s break down how this indicator works and how it can assist you in your trading strategy.
Volume Indicator:
The Volume Indicator tracks the volume of trades occurring in a specific timeframe. Volume shows the number of shares or contracts traded, which can reveal the strength of a price move. If price is moving higher with increasing volume, it generally confirms that the move has more strength, indicating the potential for continuation. Conversely, if the price is moving lower with increasing volume, it indicates strong bearish momentum.
Volume Clusters:
In the chart, we can see various volume clusters highlighted in green, red, and grey. The green bars represent high volume, which can signal strong buying pressure. The red bars represent low volume, signaling that selling pressure is low. Grey bars indicate average volume.
High Volume (Green Bars): High buying pressure, indicating that there may be a strong move in the direction of the price.
Low Volume (Red Bars): Potential signal for a weak move, indicating a lack of participation in the current trend.
RSI (Relative Strength Index):
RSI is a momentum oscillator that indicates whether a market is overbought or oversold. The RSI ranges from 0 to 100, with readings above 70 suggesting an overbought market and readings below 30 suggesting an oversold market.
The RSI is also embedded in the indicator to give a better context when combined with volume. It adds an extra layer of analysis to interpret the price action.
How to Use Volume Indicator with RSI:
Confirming Breakouts:
If you see a breakout in price (an upward movement or downward movement) and the volume indicator shows high volume, this confirms the strength of the breakout.
If the RSI also supports the breakout (for example, it is crossing above 50 or above 70 for an uptrend), it further validates the trade.
Identifying Reversals:
When the price is reaching overbought or oversold levels (RSI above 70 or below 30) and there is low volume (red bars), this may indicate a potential reversal.
If the price is oversold and RSI shows values below 30 with increasing volume (green bars), this could signal a potential buying opportunity as a reversal might occur.
Volume Divergence:
If the price is making new highs, but the volume is declining (red bars), it may signal weakness in the trend, despite the RSI indicating strength. This divergence can help traders anticipate a potential reversal or breakout.
Example from the Chart:
Strong Buy Signal: The price is making an upward movement, the volume bars are turning green (indicating strong buying pressure), and RSI is rising above 50.
Bearish Divergence: You may see RSI moving higher, but volume bars are turning red (indicating weak momentum). This could signal that the upward movement lacks strength, suggesting a potential reversal.
By combining these two indicators, the Volume Indicator and the RSI, traders can make more informed decisions on whether the current trend is sustainable, or if a reversal or breakout is likely.
In conclusion, using the Volume Indicator and RSI together allows for:
Identifying high-volume breakouts and reversals
Filtering out weak price movements
Confirming trends with volume and momentum
This combination enhances trading strategies by providing clear signals of market strength or weakness, helping traders optimize their entry and exit points effectively.

Dynamic Currency Strength IndexDescription:
This indicator calculates the relative strength of the base currency and quote currency of the currently selected forex pair. Instead of just using a single pair comparison (e.g., GBPUSD - AUDUSD), it determines currency strength using a basket of related pairs, making it more accurate and useful for trading decisions.
How It Works:
Extracts the base and quote currencies from the selected forex pair.
Calculates their individual strengths using multiple related forex pairs.
Displays the strength difference between the base and quote currencies.
How to Use:
✔️ If the strength difference is positive, the base currency is stronger → Bullish signal.
✔️ If the strength difference is negative, the quote currency is stronger → Bearish signal.
✔️ Use it to confirm trends, filter trades, and improve entry timing in forex trading.
💡 Ideal for traders using trend-based strategies (Dow Theory, HH-HL patterns, breakouts, etc.).

ZenAlgo - Advanced RSIZenAlgo - Advanced RSI is a technical indicator that combines the classic Relative Strength Index (RSI) with advanced tools, such as moving averages, histograms, divergence detection, and trend analysis. This integration provides traders with deeper insights into market dynamics, helping them identify critical entry and exit points. The indicator is designed to synergistically merge these features, delivering a comprehensive analytical tool that simplifies market analysis while providing actionable insights.
Additionally, it includes a Multi TimeFrame table, allowing traders to monitor RSI values and trends across six different timeframes in one view. This enhancement provides a broader perspective on market dynamics and helps traders identify consistent or diverging trends across multiple timeframes, enabling more precise decision-making.
Features
RSI with Moving Averages:
Offers five types of moving averages (SMA, EMA, WMA, SMMA, VWMA) to suit various trading styles and market conditions.
Moving averages are overlaid on RSI, allowing traders to detect support/resistance levels and momentum shifts directly on the RSI panel.
RSI Histogram:
Displays the difference between RSI and its moving average.
Positive histogram values indicate rising momentum, while negative values show declining momentum.
Automatically detects and highlights divergences with color-coded bars (red for bearish, green for bullish).
Bollinger Bands for RSI:
Adds upper and lower bands to RSI, visualizing volatility and overbought/oversold conditions.
Divergence Detection:
Identifies and visualizes both regular and hidden divergences, marking key reversal or trend continuation points.
Labels divergences with R (regular) or H (hidden) to provide clarity on their implications.
Bollinger Bands for RSI:
Adds upper and lower bands to RSI, visualizing volatility and overbought/oversold conditions.
Diamond Signals:
Marks crossovers of RSI and its moving average in overbought (RSI > 70) or oversold (RSI < 30) zones with diamond symbols, highlighting potential reversals.
Multi TimeFrame Table:
Displays RSI values for six different timeframes in a clear and intuitive table.
Calculates the trend on each timeframe based on the average direction of the last three candles. Trends are categorized as "rising" (increasing), "falling" (decreasing), or "neutral" (stable).
Provides easily interpretable insights across timeframes, allowing traders to focus on the current chart without switching timeframes manually.
Added Value: Why Is This Indicator Original/Why Shall You Pay for This Indicator?
ZenAlgo - Advanced RSI is a cohesive system where each component enhances the others. The originality and added value of the indicator come from:
1. Synergy Between Components:
Unlike standalone indicators, which can provide isolated or incomplete insights, ZenAlgo - Advanced RSI combines RSI, moving averages, and divergence detection into a unified system. For instance:
The RSI histogram integrates momentum and trend strength in a single visualization, eliminating the need for multiple separate tools.
Divergences are calculated using both price action and histogram trends, providing more reliable signals compared to divergence detection using only RSI.
2. Customization for Traders:
The ability to select from various moving averages (e.g., EMA for fast responses, SMA for smoother trends) allows users to tailor the indicator to different trading environments and strategies.
3. Actionable Visual Cues:
Diamond signals, histogram bars, and divergence markings make complex market patterns easier to interpret, reducing the cognitive load for traders.
4. Enhanced Divergence Analysis:
Built-in detection of regular and hidden divergences offers clarity and saves traders the effort of manually analyzing charts.
5. Bollinger Bands Integration:
Adding Bollinger Bands to RSI provides insights into volatility and momentum that go beyond what traditional Bollinger Bands or RSI can deliver individually.
6. Multi TimeFrame Table:
The Multi Time Frame table adds a new layer of analytical depth by consolidating RSI values and trends from multiple timeframes into a single tool. This helps traders identify consistent or diverging trends across timeframes, which is crucial for adjusting trading strategies to suit specific market conditions.
7. All-in-One Efficiency:
Instead of juggling multiple indicators, traders gain a streamlined tool that consolidates trend, momentum, and volatility analysis into a single, easy-to-read panel.
How It Works
1. RSI Calculation:
RSI is calculated using the standard formula to determine the relative strength of upward and downward price movements over a specified period.
2. Moving Averages:
Users choose from SMA, EMA, WMA, SMMA, or VWMA. The selected moving average is computed using RSI values, not price data, to better align with the indicator's momentum focus.
3. Histogram:
The histogram shows the difference between RSI and its moving average. Positive values indicate RSI is above its moving average, signaling increasing momentum; negative values indicate the opposite.
4. Divergence Detection:
Regular divergences are identified when price forms higher highs or lower lows, while RSI trends in the opposite direction.
Hidden divergences are marked when price forms higher lows or lower highs, but RSI trends differently.
Divergence is validated using both histogram and price trends for enhanced reliability.
5. Bollinger Bands for RSI:
The upper and lower bands are based on the RSI and a configurable standard deviation, highlighting moments of high volatility and overbought/oversold conditions.
6. Trend Analysis:
The indicator computes an average RSI value over last few candles to detect trend strength and direction, helping traders identify when trends are gaining or losing momentum.
7. Diamond Signals:
Signals are triggered when RSI crosses its moving average within overbought or oversold zones. These events are plotted as diamonds for quick visualization.
Please note that this indicator does not trigger any alerts or direct buy/sell signals.
8. Multi TimeFrame Table:
RSI values are calculated for six separate time frames chosen by the user (e.g., 1-minute, 5-minute, 1-hour).
The trend is determined by averaging the direction of the last three candles on each timeframe. Results are displayed as "rising," "falling," or "neutral" in the table.
The table serves as a quick-reference tool for analyzing trends and RSI values across multiple market perspectives.
Usage Examples
Tracking Trends: Use the histogram to monitor momentum: positive values indicate strengthening trends, while negative values suggest weakening trends.
Spotting Divergences: Look for regular divergences (R) to anticipate reversals and hidden divergences (H) to confirm trend continuation.
Utilizing Diamond Signals: When diamonds appear in overbought or oversold zones, they signal potential market reversals, allowing traders to act quickly.
Analyzing Volatility: Bollinger Bands on RSI highlight moments of high volatility, providing additional confirmation for potential trend changes.
Quick Assessment of RSI values: Use the Multi TimeFrame table to quickly assess RSI values and trends on different timeframes. Consistent trends (e.g., "rising" RSI on most timeframes) suggest market alignment, while diverging trends may indicate potential reversals or conflicting market signals. Use this insight to refine entries and exits.
Settings
RSI Length: Number of candles used for RSI calculation.
RSI Source: Data source for RSI calculation.
MA Type: Type of moving average (SMA, EMA, RMA, WMA, VWMA).
MA Length: Number of RSI values used for moving average calculation.
BB StdDev: Standard deviation length for Bollinger Bands calculation.
Disable / enable display of: Bullish, Bearish, Hidden Bullish and Hidden Bearish divergences.
Show table RSI & MA: display or hide Multi TimeFrame RSI table.
Table position / size: set MultiTimeFrame table position to suit your needs and keep it from obstructing other indicator views
Important Notes
This indicator is a technical analysis tool and does not guarantee trading success.
Use it in conjunction with other indicators and fundamental analysis for a more comprehensive trading strategy.
In strong trends, divergences may become less reliable as price action overrides momentum indicators.
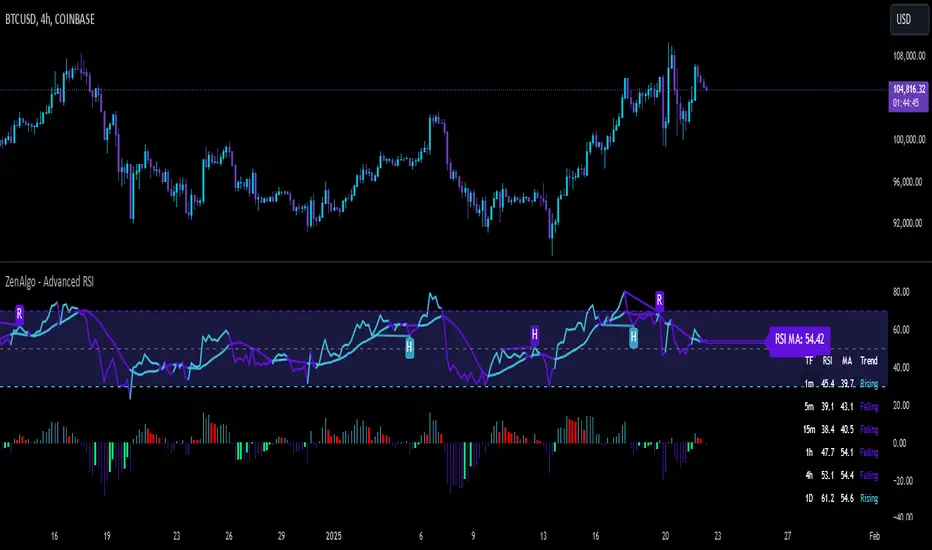
RSI BB StdDev SignalOverview
The RSI BB StdDev Signal Indicator is a powerful tool designed to enhance your trading strategy by combining the Relative Strength Index (RSI) with Bollinger Bands (BB). This unique combination allows traders to identify potential buy and sell signals more accurately by leveraging the strengths of both indicators. The RSI helps in identifying overbought and oversold conditions, while the Bollinger Bands provide a dynamic range to assess volatility and potential price reversals.
Key Features
— RSI Calculation: The indicator calculates the RSI based on user-defined parameters, allowing for customization to fit different trading styles.
— Bollinger Bands Integration: The RSI values are smoothed using a moving average, and Bollinger Bands are applied to this smoothed RSI to generate buy and sell signals.
— Divergence Detection: The indicator includes an optional feature to detect and alert on bullish and bearish divergences between the RSI and price action.
— Customizable Alerts: Users can set up alerts for buy and sell signals, as well as for divergences, ensuring they never miss a trading opportunity.
— Visual Aids: The indicator plots the RSI, Bollinger Bands, and signals on the chart, making it easy to visualize and interpret the data.
How It Works
1. RSI Calculation:
— The RSI is calculated using the change in the source input (default is close price) over a specified period.
— The RSI values are then plotted on the chart with customizable overbought and oversold levels.
2. Smoothing and Bollinger Bands:
— The RSI values are smoothed using a moving average (SMA, EMA, SMMA, WMA, VWMA) selected by the user.
— Bollinger Bands are applied to the smoothed RSI to create dynamic upper and lower bands.
3. Signal Generation:
—Buy signals are generated when the RSI crosses above the lower Bollinger Band.
—Sell signals are generated when the RSI crosses below the upper Bollinger Band.
—These signals are plotted on both the RSI pane and the main price chart for easy reference.
4. Divergence Detection:
— The indicator can detect and alert on regular bullish and bearish divergences between the RSI and price action.
— Bullish divergences occur when the price makes a lower low, but the RSI makes a higher low.
— Bearish divergences occur when the price makes a higher high, but the RSI makes a lower high.
Usage
1. Setting Up:
— Add the indicator to your TradingView chart.
— Customize the RSI length, source, and other parameters in the settings panel.
— Enable or disable the divergence detection based on your trading strategy.
2. Interpreting Signals:
— Use the buy and sell signals generated by the RSI crossing the Bollinger Bands as potential entry and exit points.
— Pay attention to divergences for additional confirmation of trend reversals.
3. Alerts:
— Set up alerts for buy and sell signals to receive notifications in real-time.
— Enable divergence alerts to be notified of potential trend reversals.
Conclusion
The RSI BB StdDev Signal Indicator is a comprehensive tool that combines the strengths of the RSI and Bollinger Bands to provide traders with more accurate and reliable signals. Whether you are a beginner or an experienced trader, this indicator can enhance your trading strategy by offering clear visual cues and customizable alerts.
Note
This indicator is provided with open-source code, allowing users to understand its logic and customize it further if needed. The detailed description and customizable settings ensure that traders of all levels can benefit from its unique features.

Custom RSI & MACD Momentum Entry SignalsIndicator Explanation: Custom RSI & MACD Momentum Entry Signals
Introduction
The "Custom RSI & MACD Momentum Entry Signals" indicator combines the Relative Strength Index (RSI) and the Moving Average Convergence Divergence (MACD) to generate precise long and short entry signals. This indicator offers a powerful combination of overbought/oversold zones, momentum analysis, and RSI-EMA crossovers to assist traders in making better decisions.
How the Indicator Works
1. RSI Calculation and EMA
The RSI is calculated based on the closing price with an adjustable period (default: 14).
An Exponential Moving Average (EMA) of the RSI (default: 9) is plotted to identify RSI trend changes.
When the RSI crosses its EMA upwards, it signals a bullish impulse. Conversely, a downward cross indicates a bearish impulse.
2. MACD Calculation and Momentum Shifts
The MACD line is derived from the difference between a fast EMA (default: 12) and a slow EMA (default: 26).
The Signal line is the EMA of the MACD line (default: 9).
The MACD histogram represents the difference between the MACD line and the Signal line.
Momentum shifts are detected as follows:
Weakening Bearish: Histogram is negative but increasing (less bearish pressure).
Strengthening Bullish: Histogram is positive and rising.
Weakening Bullish: Histogram is positive but decreasing.
Strengthening Bearish: Histogram is negative and falling.
Signal Generation
Long Signals
A Long signal is triggered when all of the following conditions are met:
The RSI was previously below 30 (oversold condition).
MACD momentum shifts from "strengthening bearish" to "weakening bearish" or turns bullish.
The RSI crosses its EMA upwards.
A green upward arrow is displayed below the bar, and the background is lightly shaded green for additional visualization.
Short Signals
A Short signal is triggered when all of the following conditions are met:
The RSI was previously above 70 (overbought condition).
MACD momentum shifts from "strengthening bullish" to "weakening bullish" or turns bearish.
The RSI crosses its EMA downwards.
A red downward arrow is displayed above the bar, and the background is lightly shaded red for additional visualization.
Visual Elements
RSI and EMA:
The RSI is shown in purple.
The RSI EMA is shown in blue.
Horizontal lines at 30 (oversold) and 70 (overbought) provide additional context.
MACD:
The MACD line is displayed in blue.
The Signal line is displayed in orange.
The zero line is added for easier interpretation.
Signals:
Green arrows: Long signals.
Red arrows: Short signals.
Background color: Light green for long conditions, light red for short conditions.
Use Cases
This indicator is ideal for:
Trend Followers: Combining RSI and MACD allows traders to identify entry points during impulsive trend shifts.
Swing Traders: Long and short signals can be used at reversal points to capture short-term price movements.
Momentum Traders: By considering MACD momentum, the indicator provides additional confidence in signal generation.
Customizable Settings
The indicator provides flexible input options:
RSI Period (default: 14)
RSI EMA Period (default: 9)
MACD Parameters: Fast, slow, and signal EMAs can be adjusted.
Conclusion
The Custom RSI & MACD Momentum Entry Signals indicator is a powerful tool for traders looking to combine RSI and MACD to identify high-probability entry signals. With clear visualization and precise signal generation, traders can make decisions more efficiently and capitalize on market movements.

RSI and Bollinger Bands Screener [deepakks444]Indicator Overview
The indicator is designed to help traders identify potential long signals by combining the Relative Strength Index (RSI) and Bollinger Bands across multiple timeframes. This combination allows traders to leverage the strengths of both indicators to make more informed trading decisions.
Understanding RSI
What is RSI?
The Relative Strength Index (RSI) is a momentum oscillator that measures the speed and change of price movements. Developed by J. Welles Wilder Jr. for stocks and forex trading, the RSI is primarily used to identify overbought or oversold conditions in an asset.
How RSI Works:
Calculation: The RSI is calculated using the average gains and losses over a specified period, typically 14 periods.
Range: The RSI oscillates between 0 and 100.
Interpretation:
Key Features of RSI:
Momentum Indicator: RSI helps identify the momentum of price movements.
Divergences: RSI can show divergences, where the price makes a higher high, but the RSI makes a lower high, indicating potential reversals.
Trend Identification: RSI can also help identify trends. In an uptrend, the RSI tends to stay above 50, and in a downtrend, it tends to stay below 50.
Understanding Bollinger Bands
What is Bollinger Bands?
Bollinger Bands are a type of trading band or envelope plotted two standard deviations (positively and negatively) away from a simple moving average (SMA) of a price. Developed by financial analyst John Bollinger, Bollinger Bands consist of three lines:
Upper Band: SMA + (Standard Deviation × Multiplier)
Middle Band (Basis): SMA
Lower Band: SMA - (Standard Deviation × Multiplier)
How Bollinger Bands Work:
Volatility Measure: Bollinger Bands measure the volatility of the market. When the bands are wide, it indicates high volatility, and when the bands are narrow, it indicates low volatility.
Price Movement: The price tends to revert to the mean (middle band) after touching the upper or lower bands.
Support and Resistance: The upper and lower bands can act as dynamic support and resistance levels.
Key Features of Bollinger Bands:
Volatility Indicator: Bollinger Bands help traders understand the volatility of the market.
Mean Reversion: Prices tend to revert to the mean (middle band) after touching the bands.
Squeeze: A Bollinger Band Squeeze occurs when the bands narrow significantly, indicating low volatility and a potential breakout.
Combining RSI and Bollinger Bands
Strategy Overview:
The strategy aims to identify potential long signals by combining RSI and Bollinger Bands across multiple timeframes. The key conditions are:
RSI Crossing Above 60: The RSI should cross above 60 on the 15-minute timeframe.
RSI Above 60 on Higher Timeframes: The RSI should already be above 60 on the hourly and daily timeframes.
Price Above 20MA or Walking on Upper Bollinger Band: The price should be above the 20-period moving average of the Bollinger Bands or walking on the upper Bollinger Band.
Strategy Details:
RSI Calculation:
Calculate the RSI for the 15-minute, 1-hour, and 1-day timeframes.
Check if the RSI crosses above 60 on the 15-minute timeframe.
Ensure the RSI is above 60 on the 1-hour and 1-day timeframes.
Bollinger Bands Calculation:
Calculate the Bollinger Bands using a 20-period moving average and 2 standard deviations.
Check if the price is above the 20-period moving average or walking on the upper Bollinger Band.
Entry and Exit Signals:
Long Signal: When all the above conditions are met, consider a long entry.
Exit: Exit the trade when the price crosses below the 20-period moving average or the stop-loss is hit.
Example Usage
Setup:
Add the indicator to your TradingView chart.
Configure the inputs as per your requirements.
Monitoring:
Look for the long signal on the chart.
Ensure that the RSI is above 60 on the 15-minute, 1-hour, and 1-day timeframes.
Check that the price is above the 20-period moving average or walking on the upper Bollinger Band.
Trading:
Enter a long position when the criteria are met.
Set a stop-loss below the low of the recent 15-minute candle or based on your risk management rules.
Monitor the trade and exit when the RSI returns below 60 on any of the timeframes or when the price crosses below the 20-period moving average.
House Rules Compliance
No Financial Advice: This strategy is for educational purposes only and should not be construed as financial advice.
Risk Management: Always use proper risk management techniques, including stop-loss orders and position sizing.
Past Performance: Past performance is not indicative of future results. Always conduct your own research and analysis.
TradingView Guidelines: Ensure that any shared scripts or strategies comply with TradingView's terms of service and community guidelines.
Conclusion
This strategy combines RSI and Bollinger Bands across multiple timeframes to identify potential long signals. By ensuring that the RSI is above 60 on higher timeframes and that the price is above the 20-period moving average or walking on the upper Bollinger Band, traders can make more informed decisions. Always remember to conduct thorough research and use proper risk management techniques.

Kalman Synergy Oscillator (KSO)The Kalman Synergy Oscillator (KSO) is an innovative technical indicator that combines the Kalman filter with two well-established momentum oscillators: the Relative Strength Index (RSI) and Williams %R. This combination aims to provide traders with a more refined tool for market analysis.
The use of the Kalman filter is a key feature of the KSO. This sophisticated algorithm is known for its ability to extract meaningful signals from noisy data. In financial markets, this translates to smoothing out price action while maintaining responsiveness to genuine market movements. By applying the Kalman filter to price data before calculating the RSI and Williams %R, the KSO potentially offers more stable and reliable signals.
The synergy between the Kalman-filtered price data and the two momentum indicators creates an oscillator that attempts to capture market dynamics more effectively. The RSI contributes its strength in measuring the magnitude and speed of price movements, while Williams %R adds sensitivity to overbought and oversold conditions. Basing these calculations on Kalman-filtered data may help reduce false signals and provide a clearer picture of underlying market trends.
A notable aspect of the KSO is its dynamic weighting system. This approach adjusts the relative importance of the RSI and Williams %R based on their current strengths, allowing the indicator to emphasize the most relevant information as market conditions change. This flexibility, combined with the noise-reduction properties of the Kalman filter, positions the KSO as a potentially useful tool for different market conditions.
In practice, traders might find that the KSO offers several potential benefits:
Smoother oscillator movements, which could aid in trend identification and reversal detection.
Possibly reduced whipsaws, particularly in choppy or volatile markets.
Potential for improved divergence detection, which might lead to more timely reversal signals.
Consistent performance across different timeframes, due to the adaptive nature of the Kalman filter.
While the KSO builds upon existing concepts in technical analysis, its integration of the Kalman filter with traditional momentum indicators offers traders an interesting tool for market analysis. It represents an attempt to address common challenges in technical analysis, such as noise reduction and false signal minimization.
As with any technical indicator, the KSO should be used as part of a broader trading strategy rather than in isolation. Its effectiveness will depend on how well it aligns with a trader's individual approach and market conditions. For traders looking to explore a more refined momentum oscillator, the Kalman Synergy Oscillator could be a worthwhile addition to their analytical toolkit.

GBP Index vs CAD Index Currency OscillatorGBP vs CAD Currency Oscillator
This custom oscillator compares the relative strength of GBP (British Pound) and CAD (Canadian Dollar) against a basket of other currencies to determine potential overbought and oversold conditions. The indicator is designed to help traders evaluate momentum shifts and identify possible trend reversals between these two currencies, not just the GBPCAD pair.
How it Works:
Currency Index Calculation:
The oscillator calculates the average percentage change in 7 key GBP pairs (GBPUSD, EURGBP, GBPJPY, GBPAUD, GBPNZD, GBPCAD, and GBPCHF).
Similarly, it calculates the average percentage change for 7 key CAD pairs (USDCAD, EURCAD, CADJPY, AUDCAD, NZDCAD, GBPCAD, and CADCHF).
Stochastic Oscillator:
The indicator calculates a 0-100 oscillator for both the GBP and CAD currency indices based on the highest high and lowest low over a user-defined lookback period (default is 14 anlthough 60 works great on 1m chart).
The oscillator is smoothed using a simple moving average (default smoothing period is 3) to reduce noise and improve visual clarity.
Overbought/Oversold Conditions:
Overbought: When both the GBP and CAD oscillators exceed 80, the background turns red, indicating potential overbought conditions.
Oversold: When both oscillators fall below 20, the background turns green, signaling possible oversold conditions.
Crossovers:
When the GBP oscillator crosses above the CAD oscillator, a green dot appears at the bottom of the chart, signaling potential GBP strength.
When the GBP oscillator crosses below the CAD oscillator, a red dot appears, signaling potential CAD strength.
How to Use:
Overbought/Oversold Conditions: Use the red and green background highlights to spot potential overbought or oversold market conditions, helping you identify possible turning points.
Customization Options:
Lookback Period: You can adjust the lookback period for the stochastic calculation, allowing for sensitivity tuning (default: 14).
Smoothing Period: Control the degree of smoothing applied to the oscillators (default: 3).
This oscillator is ideal for traders focused on trading GBP and CAD pairs, offering a comparative analysis that can assist in better decision-making based on relative currency strength.